


If you’ve ever wondered about the various facets of quantitative data analysis, you’re in for a treat. Understanding the three types of quantitative data analysis is pivotal for unraveling the intricate tapestry of numerical information. By grasping these different approaches, you’ll be equipped to extract valuable insights that can shape the trajectory of decision-making processes. Stay tuned to uncover the distinct methodologies used to analyze data and gain a deeper appreciation for the power of quantitative analysis in today’s data-driven world.
Types of Quantitative Data
When examining the types of quantitative data, it is vital to distinguish between discrete and continuous data for precise analysis and interpretation. Discrete data involves distinct values that are countable, such as the number of customers or products sold. On the other hand, continuous data includes measurements that can be any value within a range, like temperature or time. Data segmentation allows for the categorization of information based on specific criteria, aiding in statistical modeling to identify patterns and relationships within the data. Correlation analysis helps to determine the strength and direction of relationships between variables, while data visualization techniques like charts and graphs facilitate the communication of insights. Trend identification is crucial for recognizing patterns over time, enabling informed decision-making based on historical data. By understanding these distinctions and utilizing appropriate analytical tools, you can effectively interpret and derive valuable insights from quantitative data.
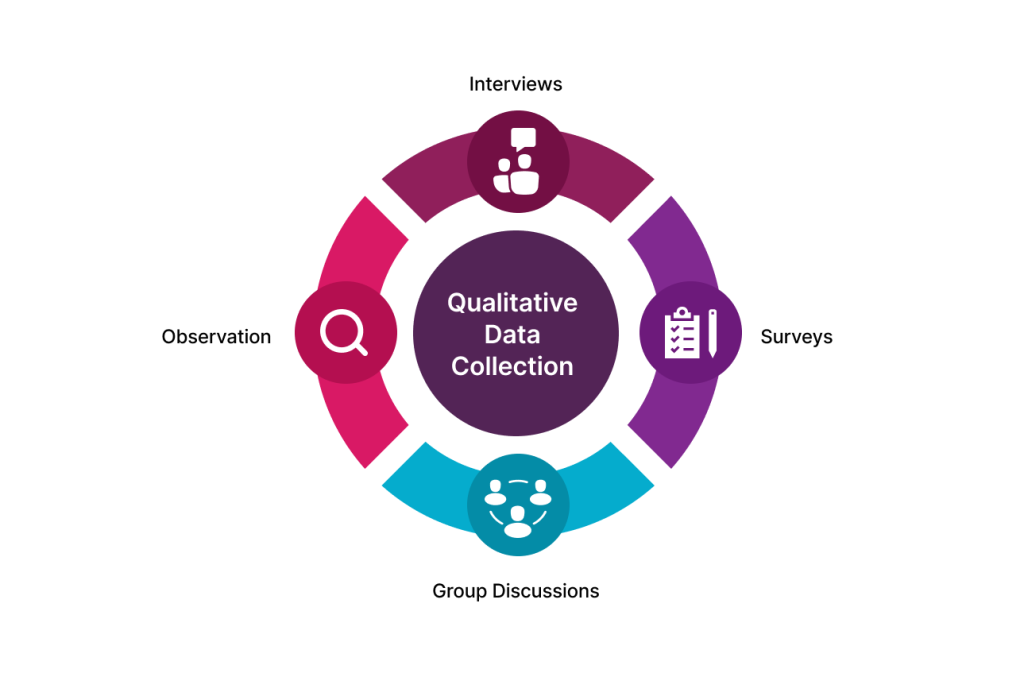
Methods for Data Collection
To ensure the reliability and validity of your research findings, selecting appropriate methods for data collection is paramount. Incorporating various techniques such as sampling, surveys, interviews, open data sources, and questionnaire design can greatly impact the quality of your data. Here is a structured breakdown of these methods in a table format:
| Method | Description |
|---|---|
| Sampling techniques | Utilize methods like Simple random, Systematic random, and Stratified random sampling to eliminate bias. |
| Survey methodologies | Conduct surveys through paper-based or online platforms with closed-ended questions for data collection. |
| Interview strategies | Employ face-to-face, telephonic, or online interviews structured to gather specific data points. |
| Open data sources | Access publicly available datasets to supplement your research with external sources of information. |
| Questionnaire design | Design structured questionnaires with clear, concise, and relevant questions to gather specific data efficiently. |
Techniques for Data Analysis
Utilize a variety of advanced statistical techniques to uncover insightful patterns and relationships within your quantitative data analysis. Start by employing statistical modeling to identify complex relationships between variables. Data visualization tools such as charts and graphs can help you interpret and communicate your findings effectively. Conduct correlation analysis to understand the strength and direction of relationships between different variables. Regression techniques allow you to predict outcomes based on the relationships identified in your data. Finally, hypothesis testing enables you to draw conclusions and make informed decisions based on the significance of your results. By integrating these techniques into your data analysis process, you can gain a deeper understanding of your data and extract valuable insights to drive strategic decision-making. Remember, the key to successful quantitative data analysis lies in employing a combination of these techniques thoughtfully and strategically.
Advantages of Quantitative Analysis
Uncover the significant advantages of quantitative analysis by leveraging statistical techniques to extract valuable insights from your data. One key advantage is data accuracy, ensuring precise and reliable results. Statistical benefits enable you to analyze data with robust methods, identifying patterns and relationships efficiently. This analysis leads to decision-making insights, providing a basis for informed and strategic actions. Quantitative analysis also yields unbiased outcomes, minimizing the influence of personal bias and enhancing the objectivity of your conclusions. Moreover, quick interpretation of quantitative data allows for timely responses to changing scenarios, aiding in the agility of decision-making processes. By embracing quantitative analysis, you can harness the power of numerical data to derive meaningful insights, enhance the accuracy of your conclusions, and make well-informed decisions driven by statistical evidence.
Disadvantages in Data Analysis
While quantitative data analysis offers valuable insights, it is crucial to acknowledge the limitations and disadvantages that can impact the process. When engaging in quantitative data analysis, you may encounter the following challenges:
- Limitations in analysis: The complexity of data sets and the need for specialized statistical knowledge can limit the depth of analysis and the ability to draw meaningful conclusions.
- Challenges in interpretation: Interpreting quantitative data correctly requires a deep understanding of the context in which the data was collected, as misinterpretation can lead to erroneous conclusions.
- Drawbacks of statistics: Relying solely on statistical analysis may overlook important qualitative aspects of the data, potentially missing key insights.
- Pitfalls in research: Inadequate sample sizes, biased sampling methods, or flawed research designs can introduce biases and errors into the analysis, undermining the validity of the findings.
- Shortcomings in findings: Quantitative data analysis may not always capture the full complexity of a research question, leading to oversimplified or incomplete findings.
Data Preparation and Cleaning
Data preparation and cleaning are essential steps in the quantitative data analysis process to ensure the accuracy and reliability of your findings. It involves techniques such as data validation, outlier detection, cleaning techniques for error removal, checking data consistency and relevance, maintaining integrity by removing duplicates, and ensuring accuracy assurance through the removal of irrelevant data.
To delve deeper into data preparation and cleaning, the table below outlines key aspects of this critical process:
| Data Preparation and Cleaning | Description |
|---|---|
| Data Validation | Ensuring data accuracy and reliability through validation processes. |
| Outlier Detection | Identifying and handling outliers that may skew the analysis results. |
| Cleaning Techniques | Implementing methods to clean data from errors and inconsistencies. |
| Data Consistency, Relevance Checking | Verifying that the data is consistent and relevant to the analysis objectives. |
| Maintaining Integrity, Removing Duplicates | Ensuring the integrity of data by removing duplicates and maintaining data quality. |
| Accuracy Assurance, Irrelevant Data Removal | Guaranteeing accurate results by eliminating irrelevant data that could impact the analysis. |
Analyzing and Interpreting Data
To gain meaningful insights from your quantitative data analysis, it is crucial to employ statistical techniques that reveal patterns and relationships within the data. When analyzing and interpreting your data, consider the following:
- Exploratory Analysis: Conduct an exploratory analysis to understand the basic characteristics of your data, identify outliers, and detect patterns that may guide further investigation.
- Correlation Patterns: Explore correlation patterns between variables to uncover potential relationships and dependencies that can provide valuable insights for decision-making.
- Statistical Significance: Determine statistical significance in your findings to ensure that observed relationships are not due to random chance but are meaningful and reliable.
- Data Visualization: Utilize data visualization techniques such as charts, graphs, and tables to present your findings visually, aiding in the interpretation of complex data sets and facilitating communication of insights to stakeholders.
Visualizing and Sharing Insights
Consider employing data visualization techniques like charts, graphs, and tables to enhance the comprehension and communication of your quantitative data insights effectively. Enhancing communication through visual presentation is crucial for stakeholder engagement. Data visualization not only aids in conveying complex data in a clear and concise manner but also facilitates insight sharing within your team or organization. Engaging data visualizations help in presenting results effectively, enabling stakeholders to grasp key findings swiftly.
Sharing data insights with stakeholders is essential for collaborative decision-making and strategy development. Utilizing visually appealing representations of data can make the information more accessible and impactful, leading to more informed discussions and actions. By incorporating data visualization into your workflow, you can streamline the communication of quantitative data, ensuring that insights are effectively conveyed and understood by all involved parties.